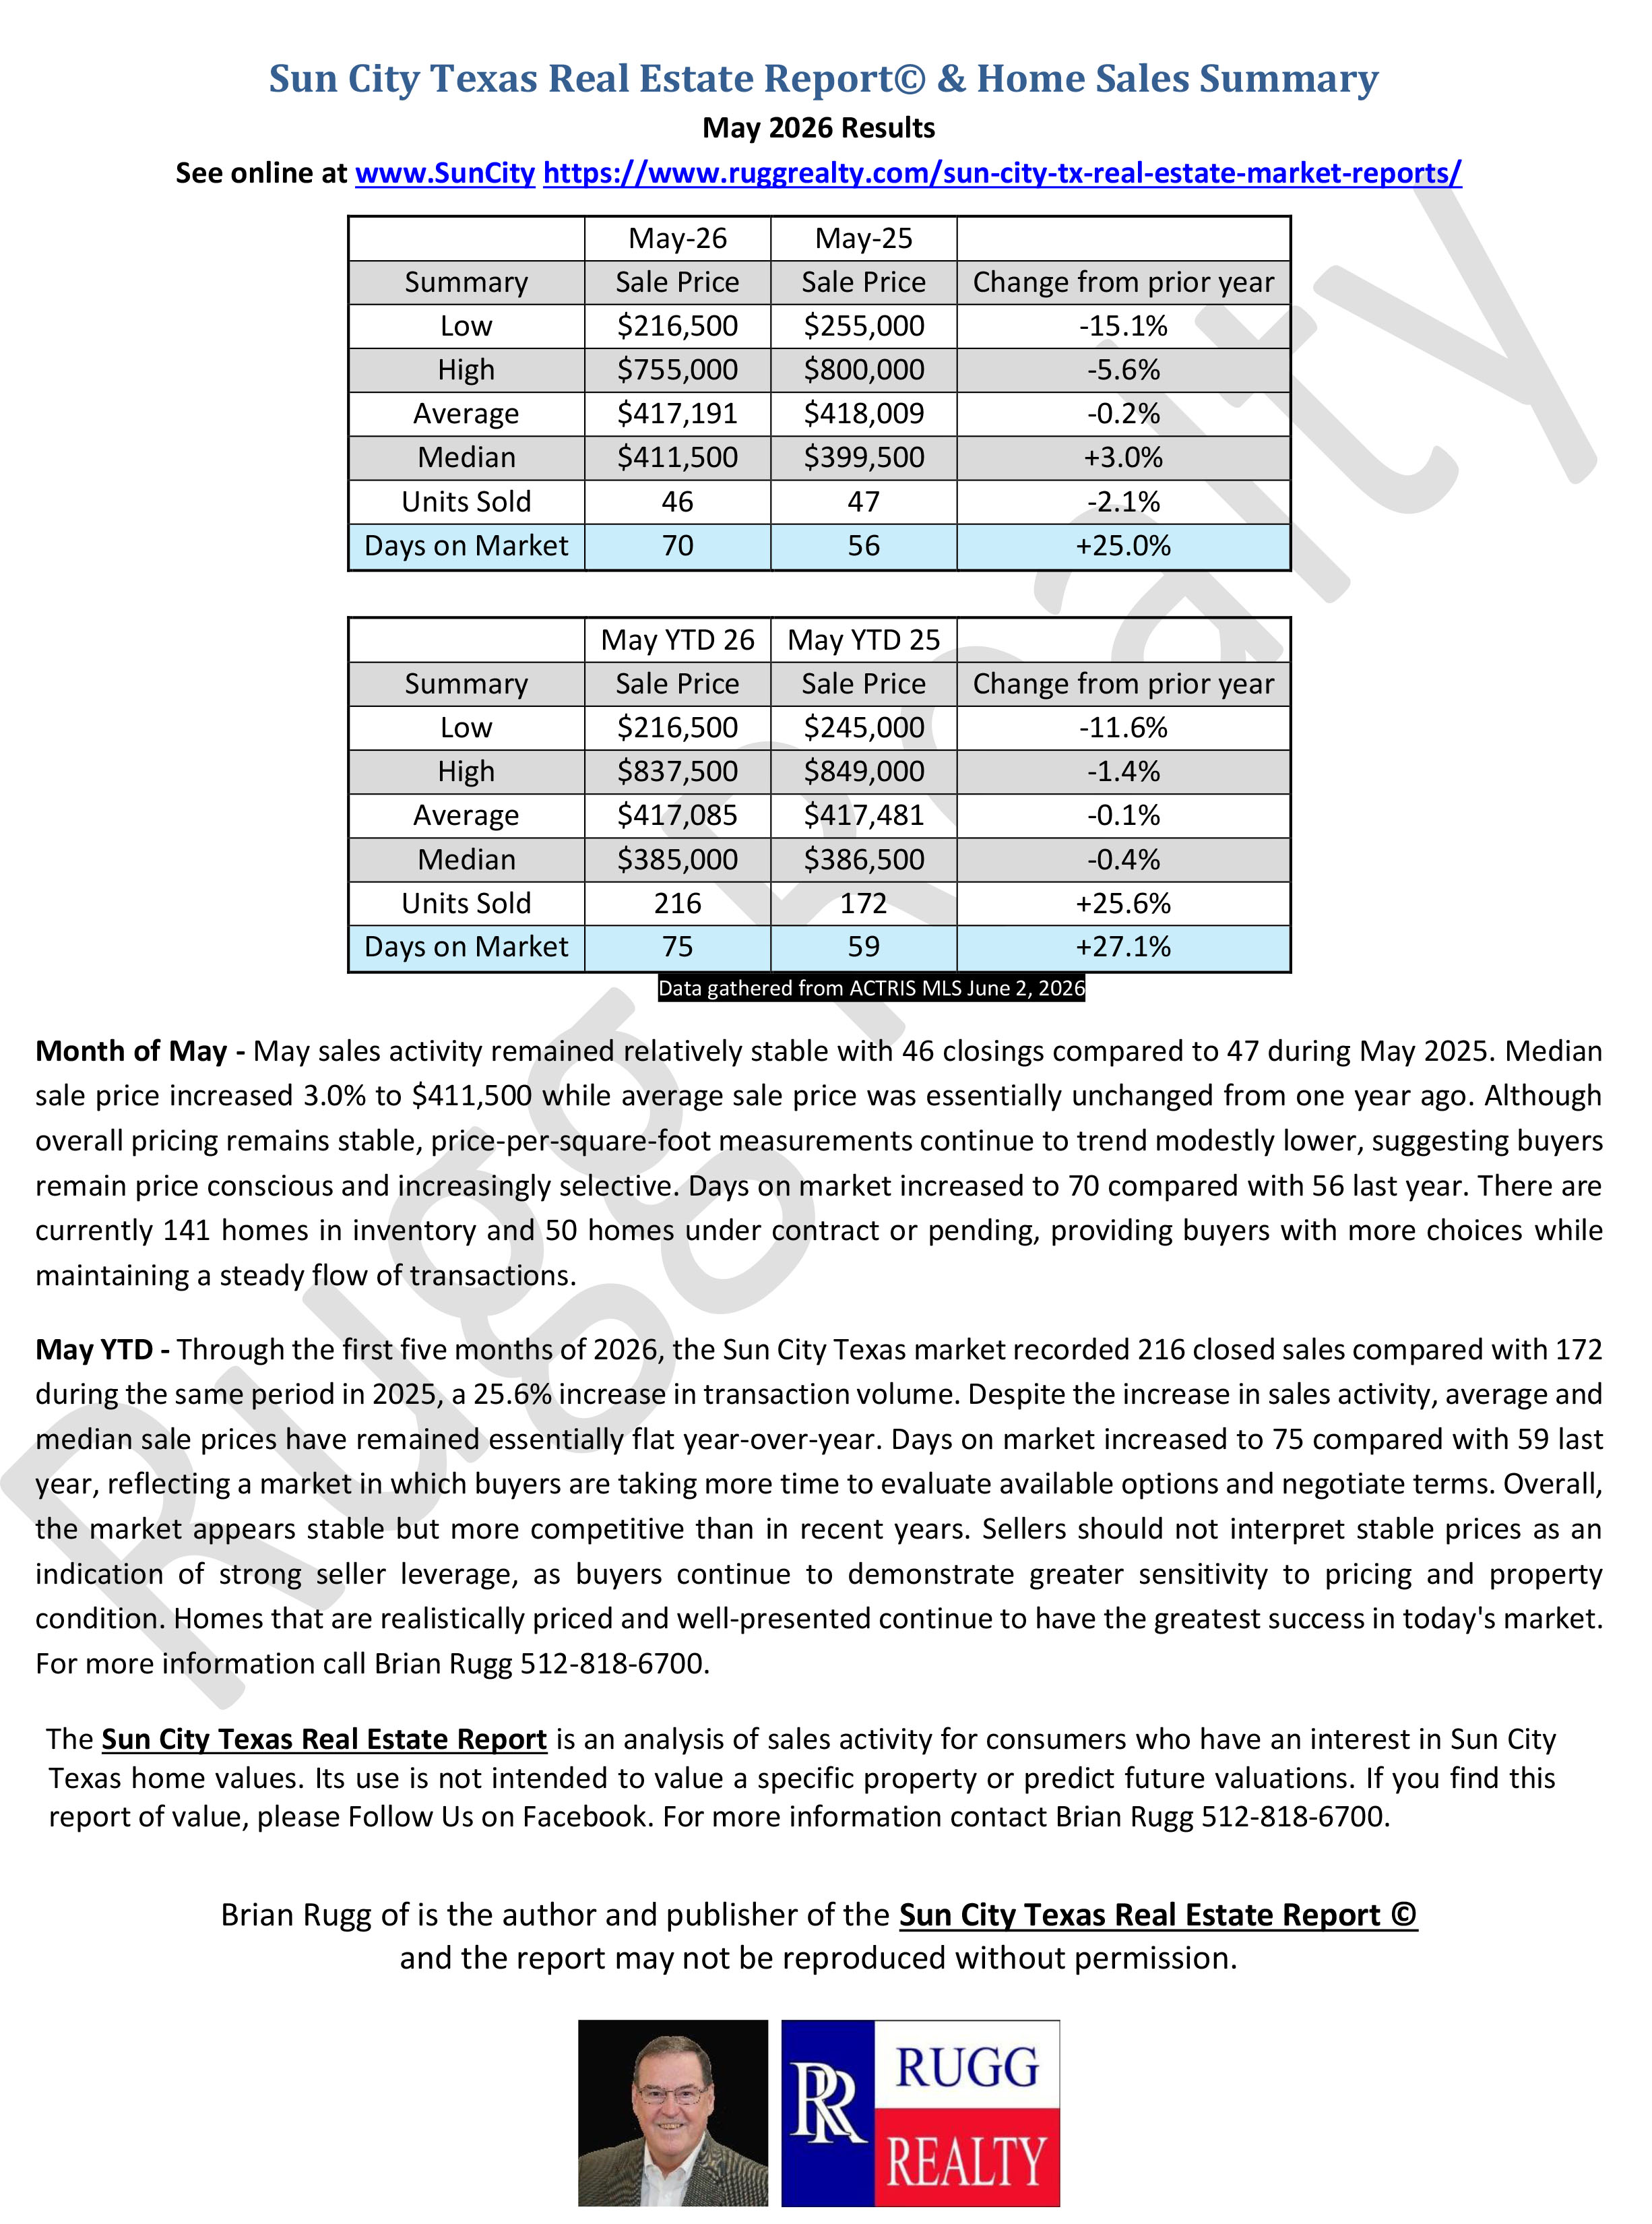
May 2026 Results
See online at www.SunCity https://www.ruggrealty.com/sun-city-tx-real-estate-market-reports/
|
May-26 |
May-25 |
||
|
Summary |
Sale Price |
Sale Price |
Change from prior year |
|
Low |
$216,500 |
$255,000 |
-15.1% |
|
High |
$755,000 |
$800,000 |
-5.6% |
|
Average |
$417,191 |
$418,009 |
-0.2% |
|
Median |
$411,500 |
$399,500 |
+3.0% |
|
Units Sold |
46 |
47 |
-2.1% |
|
Days on Market |
70 |
56 |
+25.0% |
|
May YTD 26 |
May YTD 25 |
||
|
Summary |
Sale Price |
Sale Price |
Change from prior year |
|
Low |
$216,500 |
$245,000 |
-11.6% |
|
High |
$837,500 |
$849,000 |
-1.4% |
|
Average |
$417,085 |
$417,481 |
-0.1% |
|
Median |
$385,000 |
$386,500 |
-0.4% |
|
Units Sold |
216 |
172 |
+25.6% |
|
Days on Market |
75 |
59 |
+27.1% |
Data gathered from ACTRIS MLS June 2, 2026
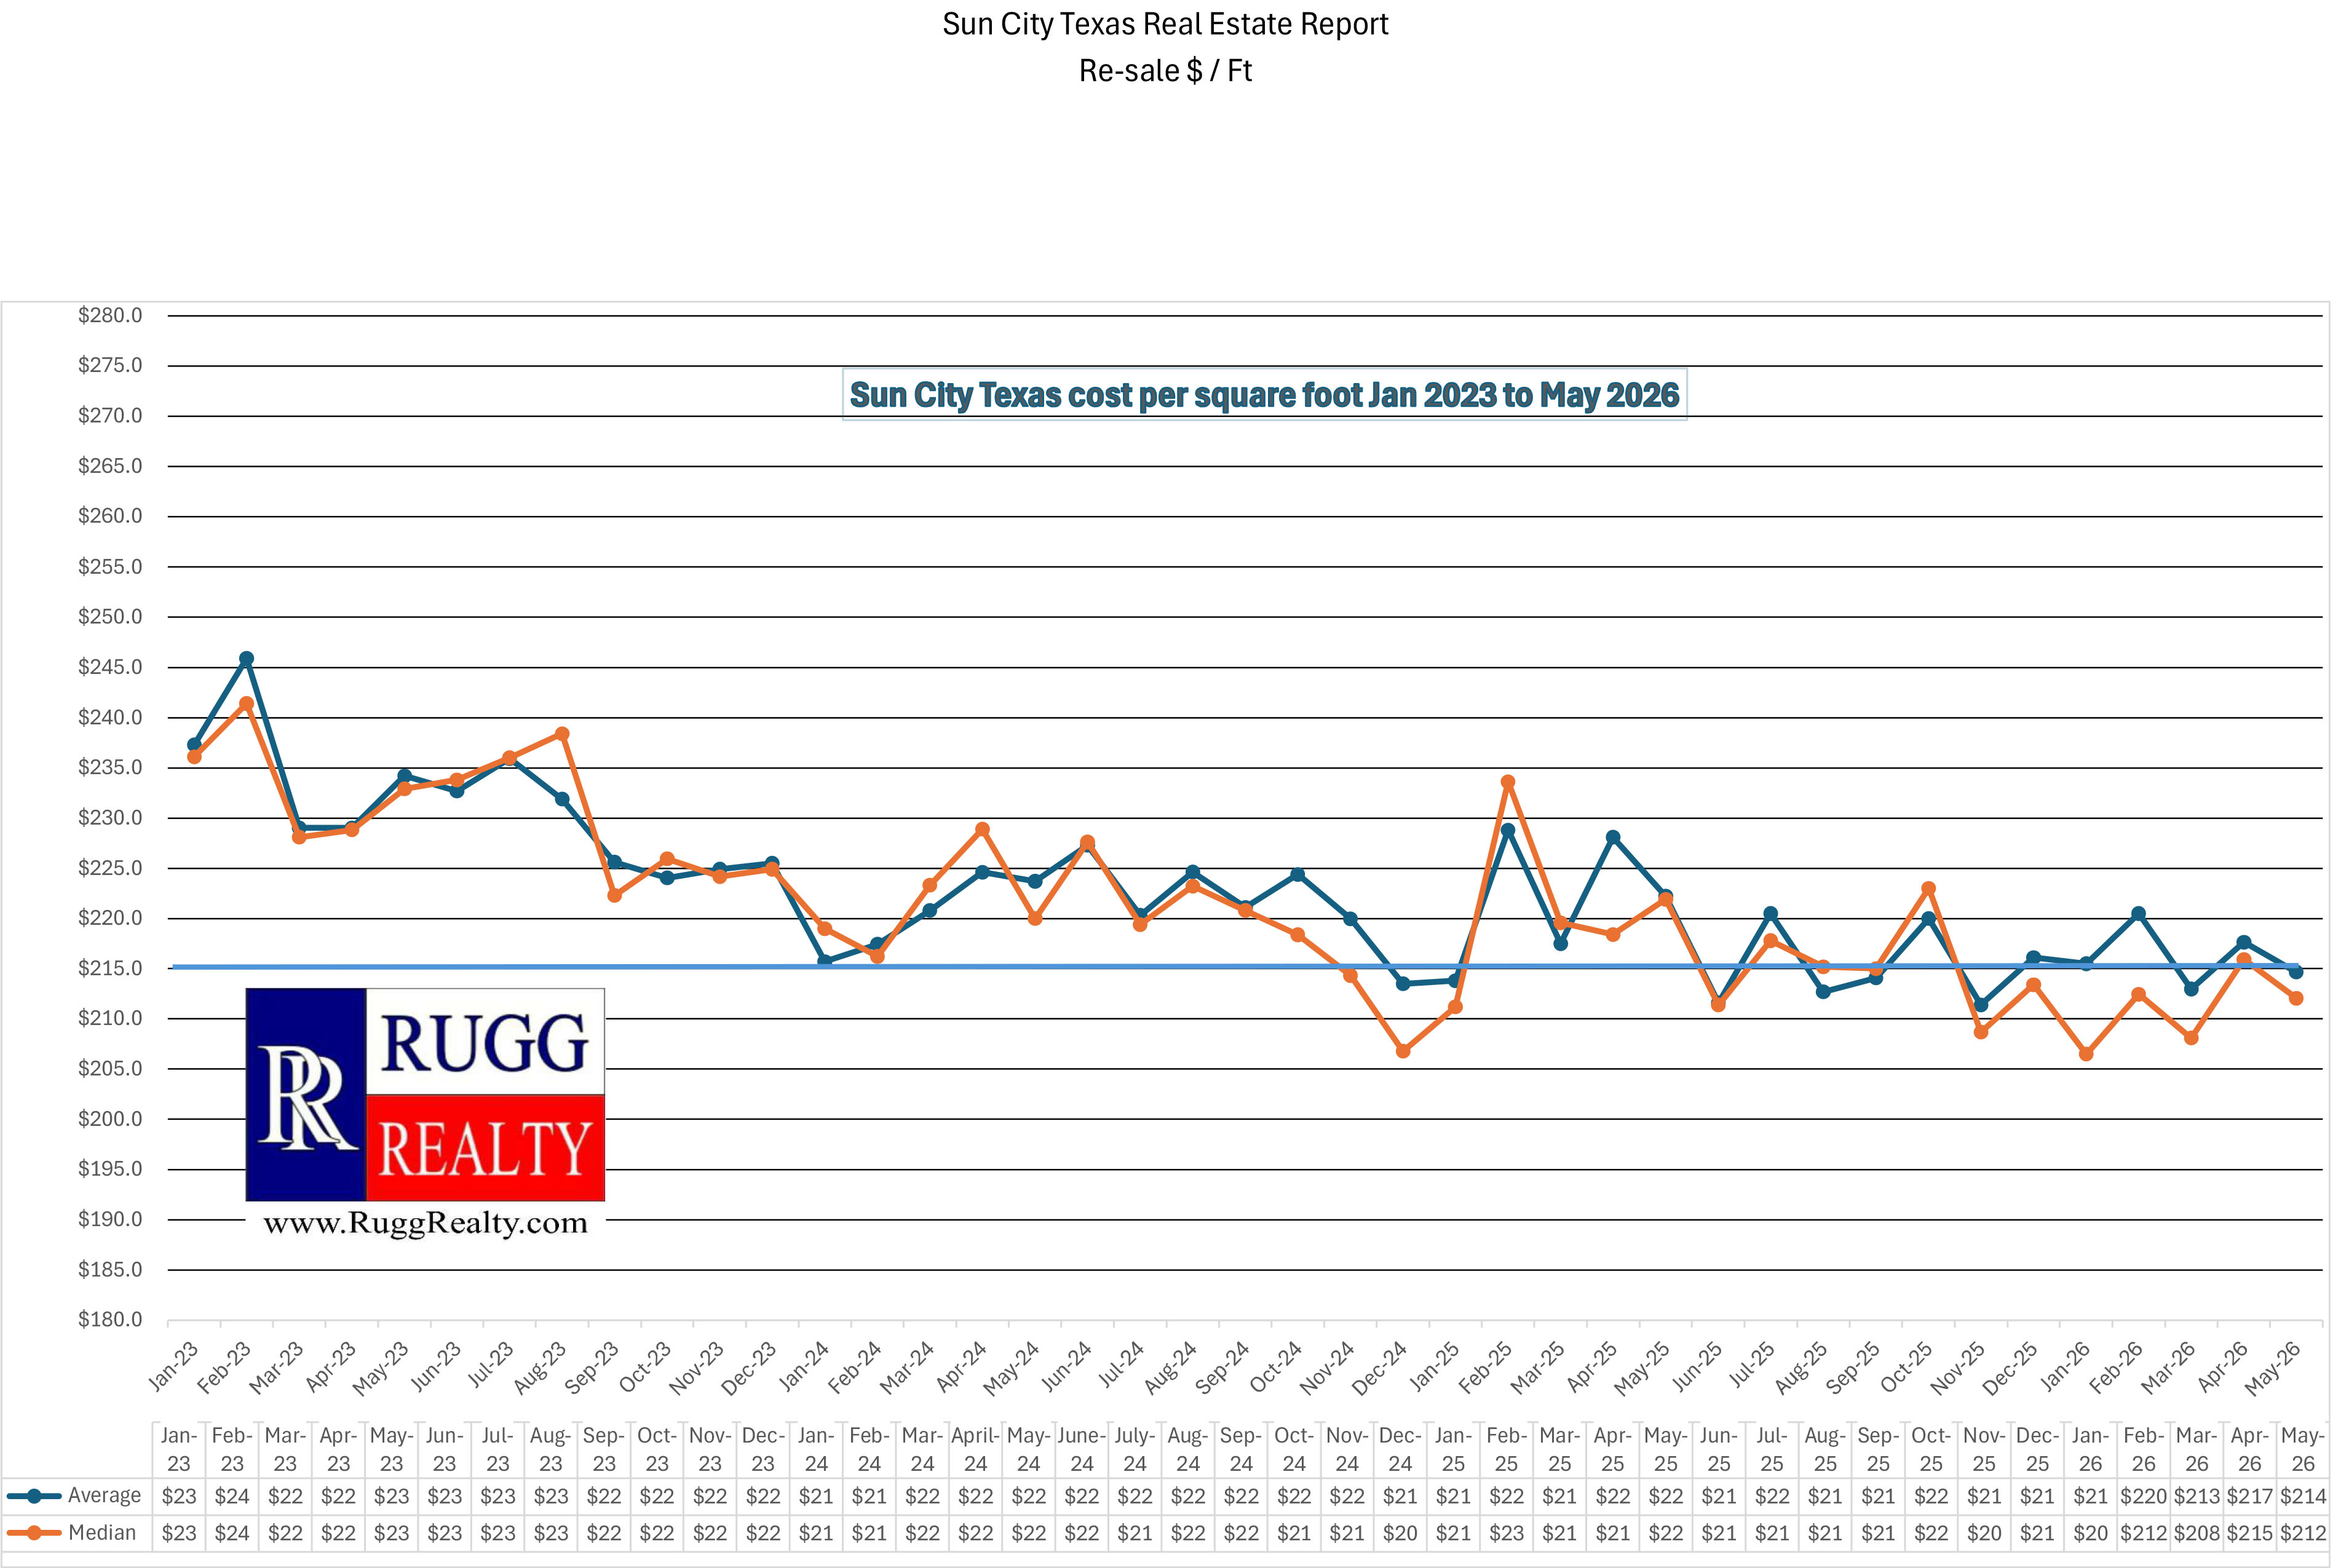
Month of May - May sales activity remained relatively stable with 46 closings compared to 47 during May 2025. Median sale price increased 3.0% to $411,500 while average sale price was essentially unchanged from one year ago. Although overall pricing remains stable, price-per-square-foot measurements continue to trend modestly lower, suggesting buyers remain price conscious and increasingly selective. Days on market increased to 70 compared with 56 last year. There are currently 141 homes in inventory and 50 homes under contract or pending, providing buyers with more choices while maintaining a steady flow of transactions.
May YTD - Through the first five months of 2026, the Sun City Texas market recorded 216 closed sales compared with 172 during the same period in 2025, a 25.6% increase in transaction volume. Despite the increase in sales activity, average and median sale prices have remained essentially flat year-over-year. Days on market increased to 75 compared with 59 last year, reflecting a market in which buyers are taking more time to evaluate available options and negotiate terms. Overall, the market appears stable but more competitive than in recent years. Sellers should not interpret stable prices as an indication of strong seller leverage, as buyers continue to demonstrate greater sensitivity to pricing and property condition. Homes that are realistically priced and well-presented continue to have the greatest success in today's market. For more information call Brian Rugg 512-818-6700.
|
The Sun City Texas Real Estate Report is an analysis of sales activity for consumers who have an interest in Sun City Texas home values. Its use is not intended to value a specific property or predict future valuations. If you find this report of value, please Follow Us on Facebook. For more information contact Brian Rugg 512-818-6700. |
Brian Rugg is the author and publisher of the Sun City Texas Real Estate Report ©
and the report may not be reproduced without permission.


Brian@RuggRealty.com | 512-818-6700
|
The Sun City Texas Real Estate Report is an analysis of sales activity for consumers who have an interest in Sun City Texas home values. Its use is not intended to value a specific property or predict future valuations. If you find this report of value, please Follow Us on Facebook. For more information contact Brian Rugg 512-818-6700. |
Visit our YouTube Channel "Living Large in Sun City Texas 55 Plus
Click link above or scan QR code below:

Want an archived report? Send a request to Brian@RuggRealty.com


