Sun City Texas Real Estate Report
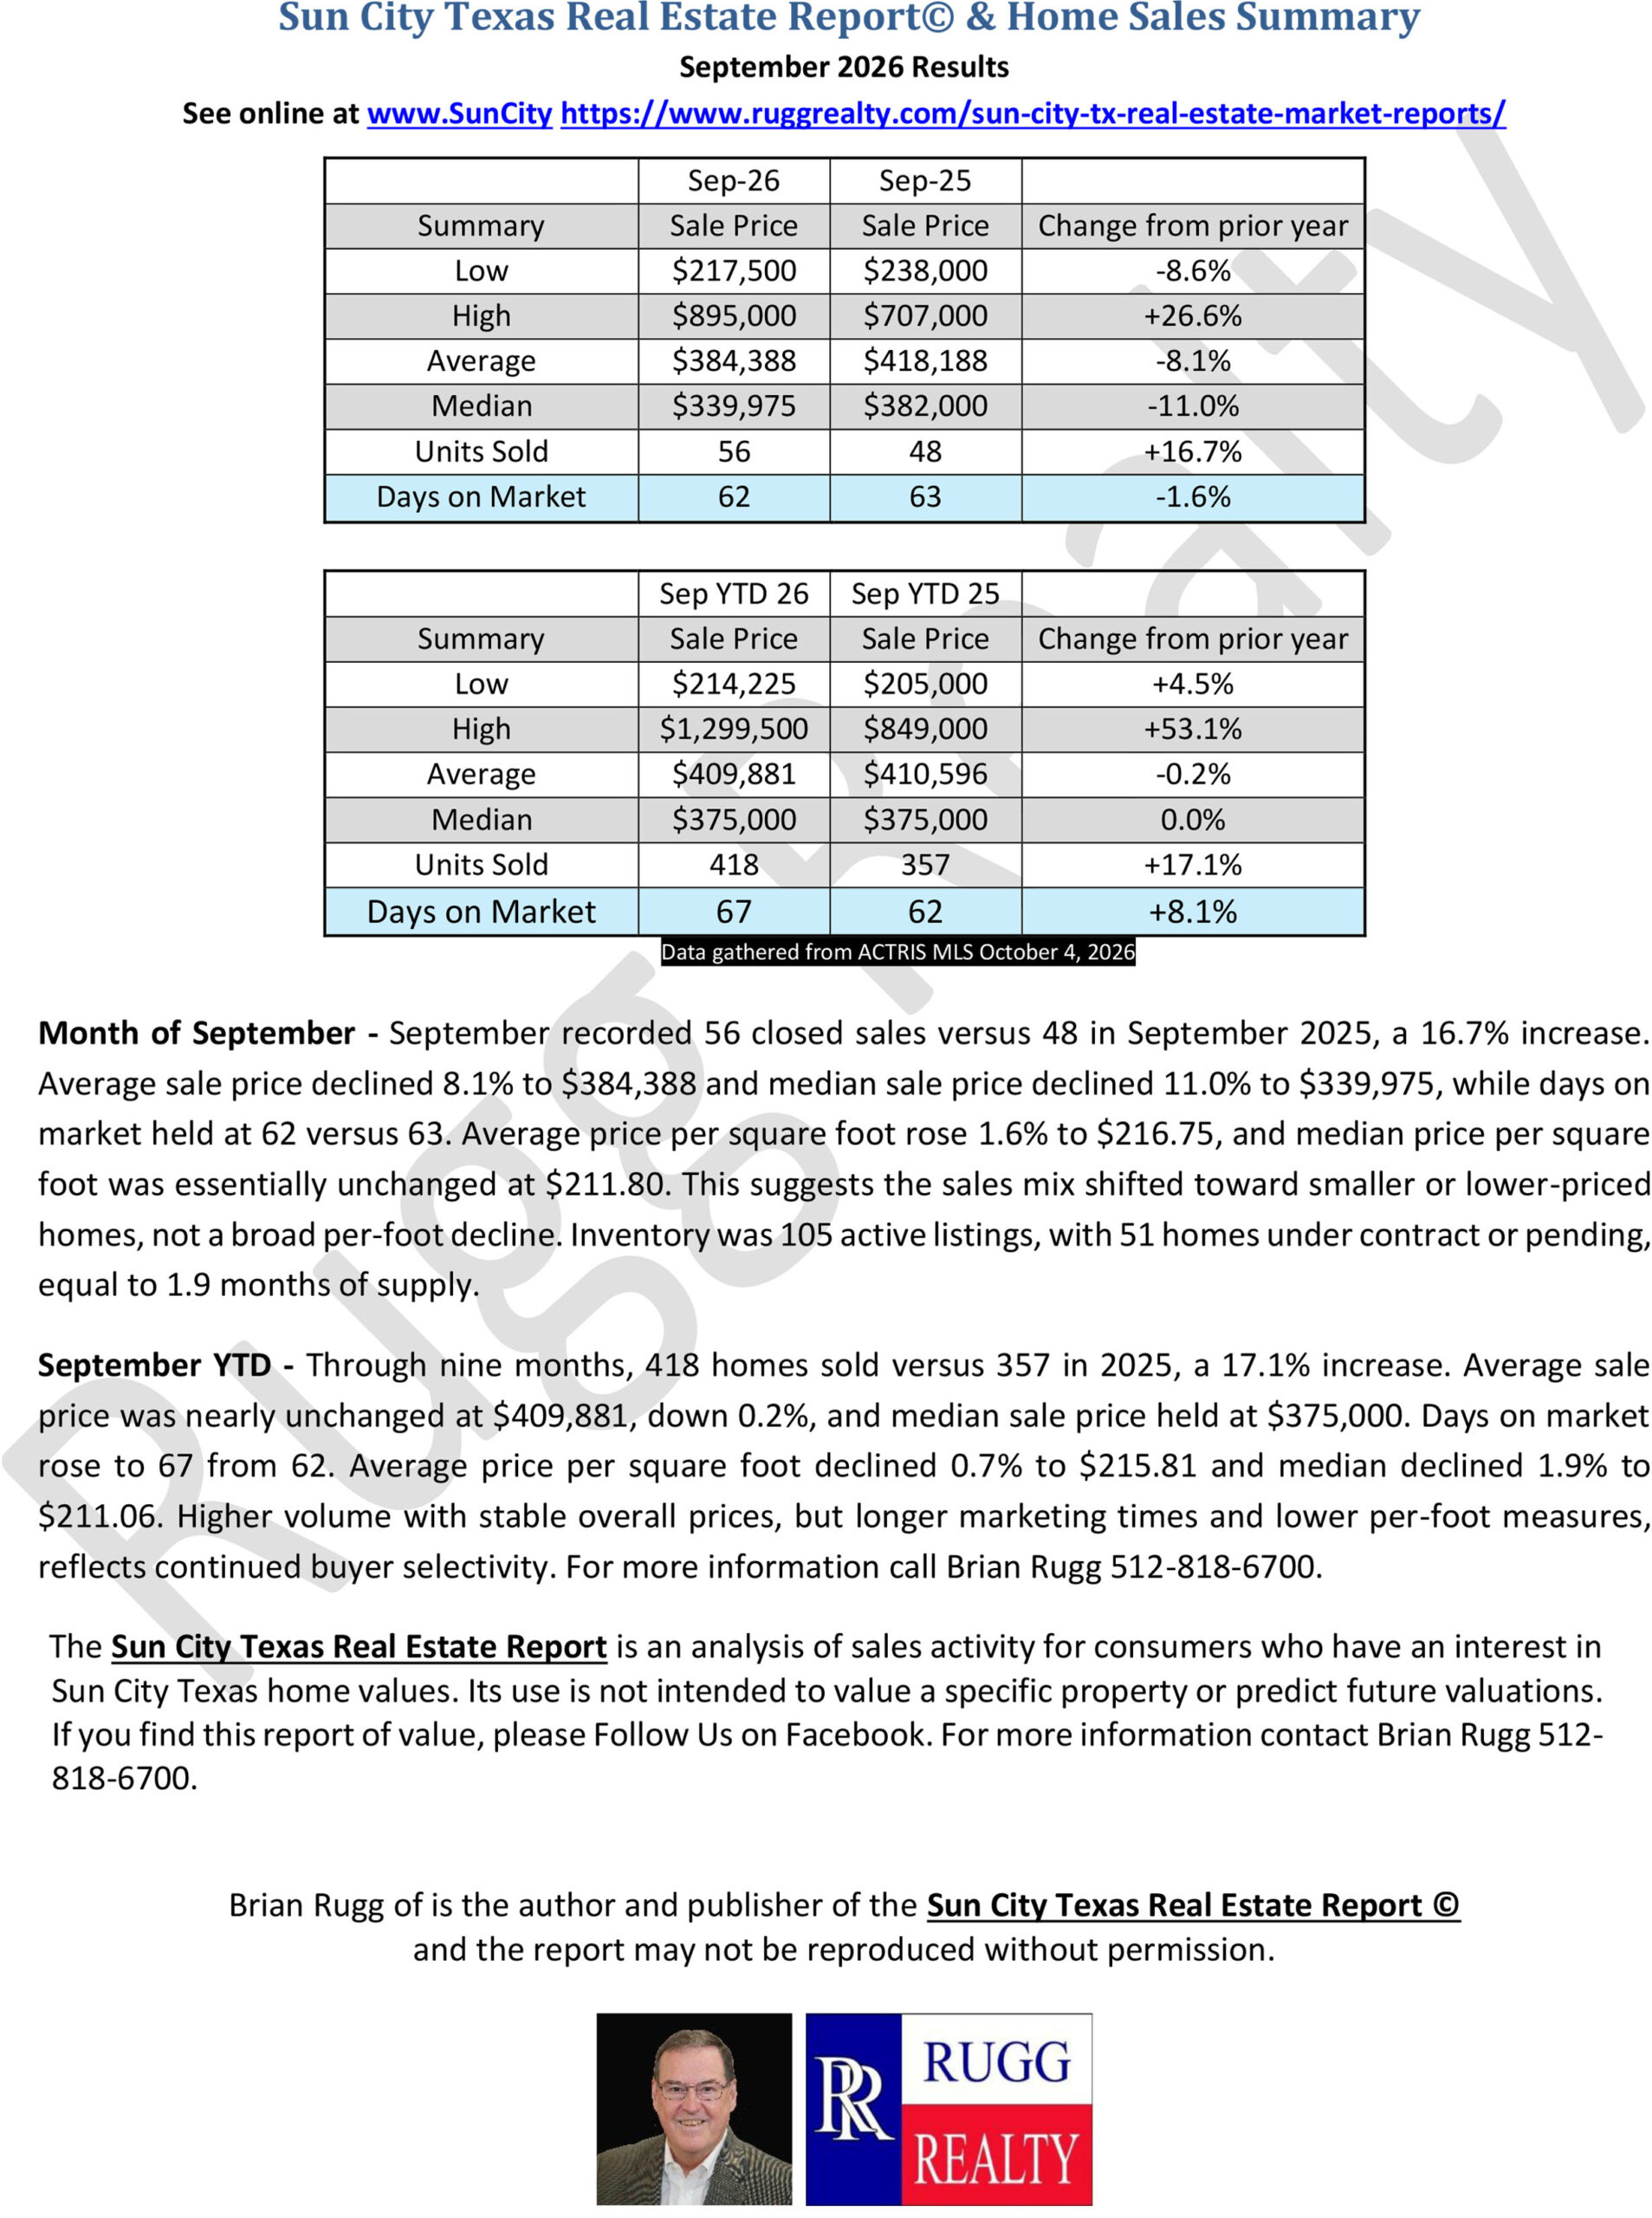
September 2026 market report
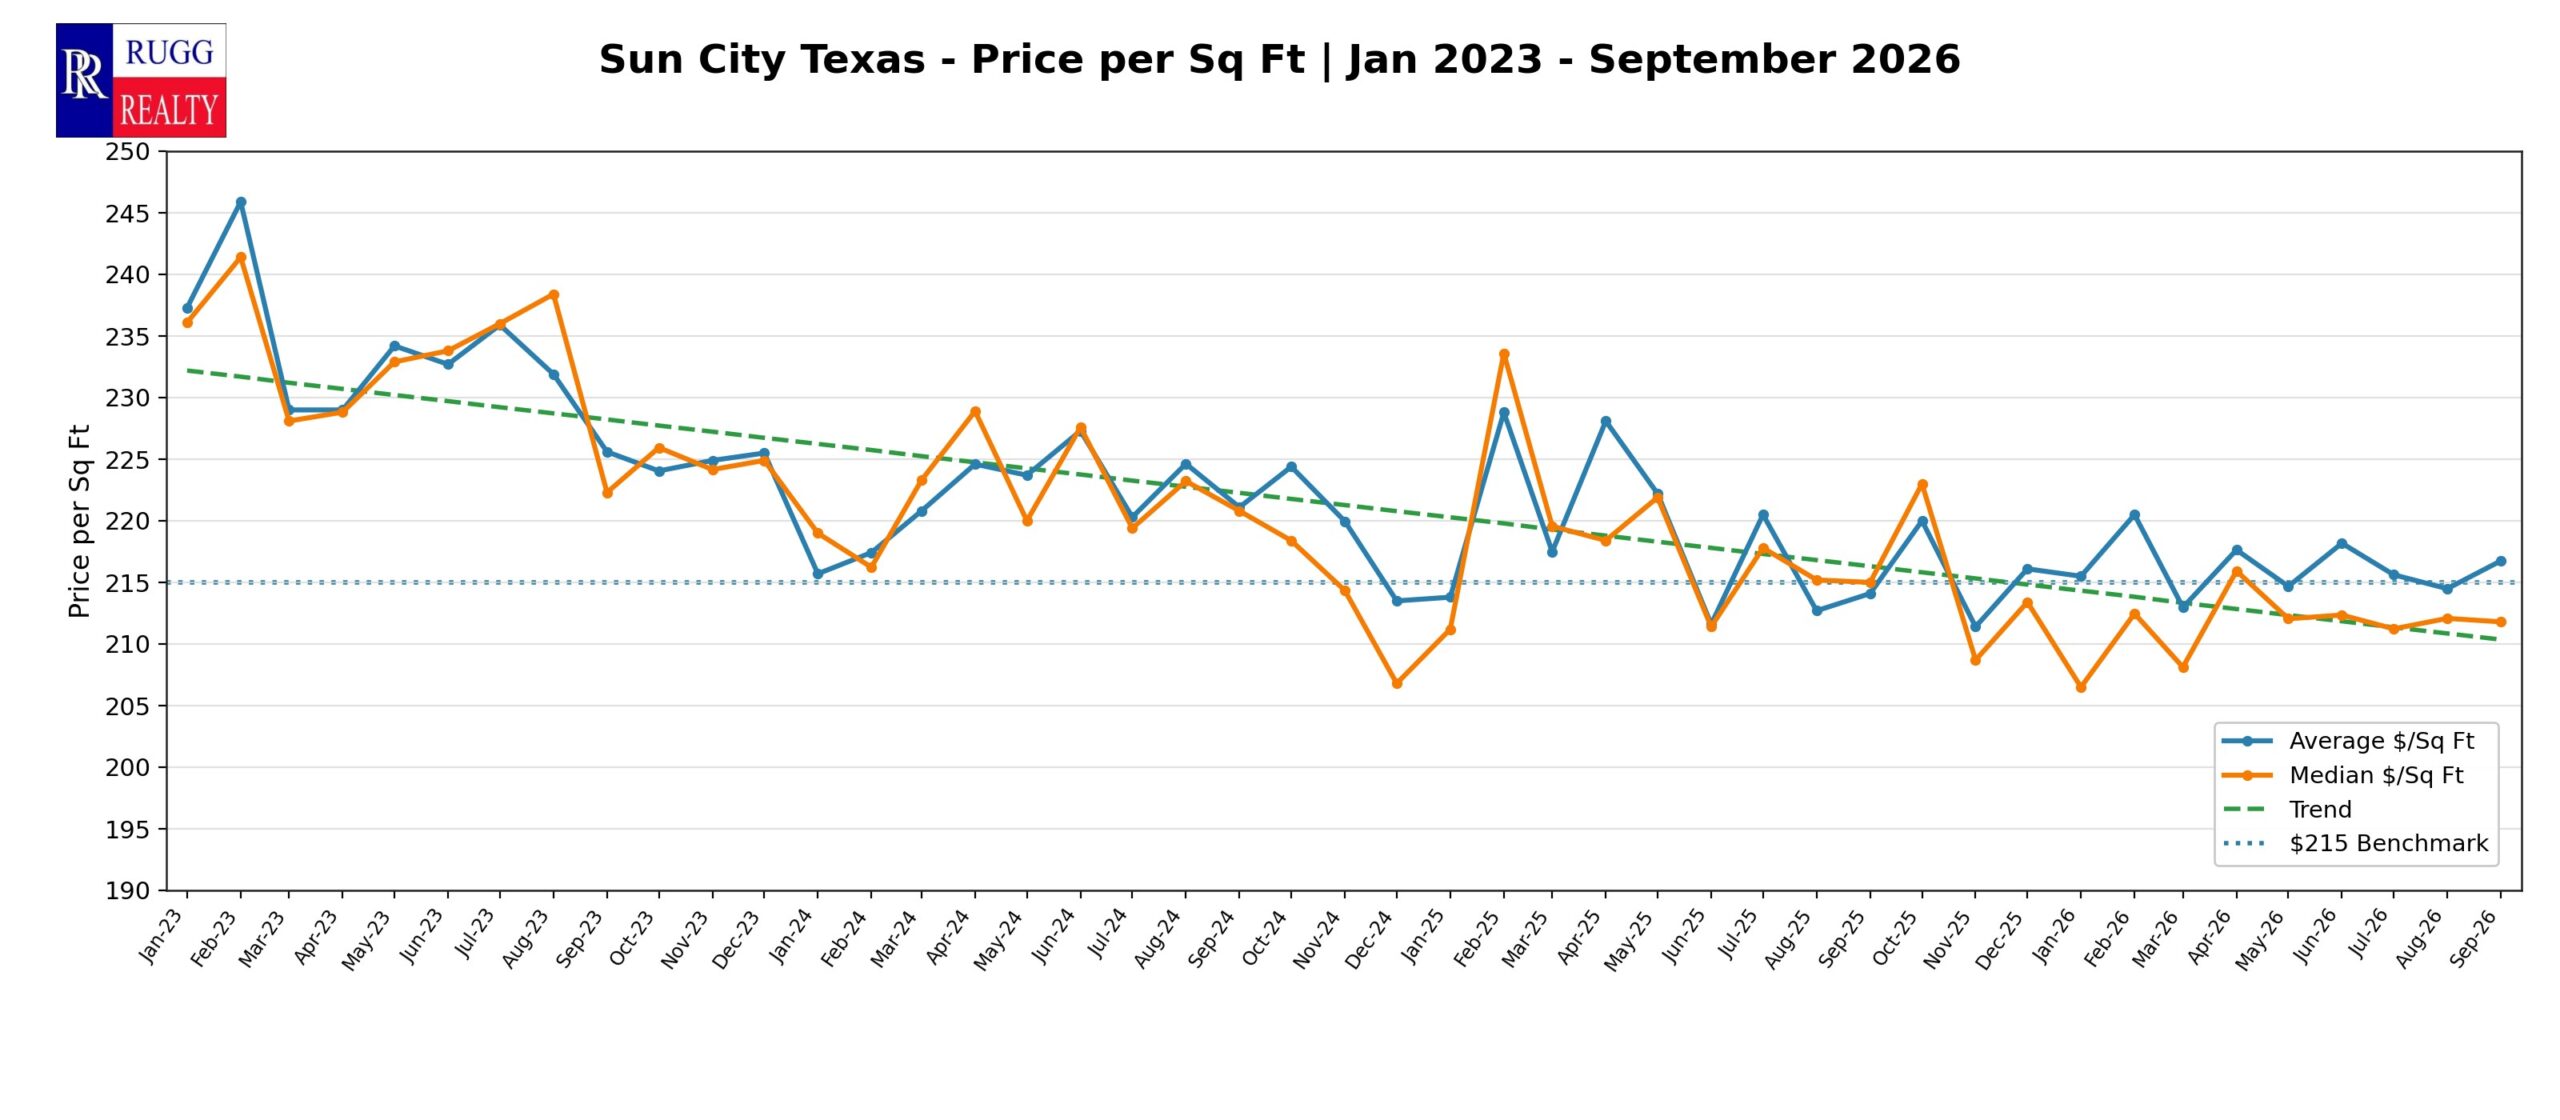
Sun City Texas price per square foot
The Sun City Texas Real Estate Report is designed to answer a simple question: what is the resale market actually doing? We publish the report monthly using MLS data and keep the commentary focused on the numbers rather than sales promotion.
What the report tracks
- Monthly and year-to-date home sales
- Average and median sale prices
- Average and median price per square foot
- Days on market
- List-to-sale price relationship
- Active inventory and pending sales
- Absorption rate and broader market direction
Why Sun City needs its own report
Sun City is large enough to behave like a market within a market. Citywide or countywide statistics can hide what is happening inside the community. Floor-plan mix, age of homes, updates, lot type and builder competition can all influence monthly results.
Price per square foot over time
We maintain a monthly price-per-square-foot history to make longer trends easier to see. One month can be noisy; a consistent series gives sellers and buyers better context.
Useful whether you are moving or not
Many Sun City residents follow the report simply because they want to understand the value of the community they live in. Buyers use it to learn the market before making an offer, and sellers use it to understand current competition before deciding when and how to list.
Latest report: September 2026
Read or download the September 2026 Sun City Texas Real Estate Report (PDF)
Save this page for the latest published report. As new reports are published, the download above will be updated.
Read the numbers in context
A change in the mix of homes sold can move an average or median even when individual home values have not changed by the same amount. Compare monthly results with year-to-date activity and longer trends, then consider the condition, layout and location of the particular home.